Research

I use mathematical modeling and machine learning to understand how individual behaviour, intervention strategies, and structural conditions combine to shape population health.

Research statement

My work sits at the intersection of mathematical epidemiology, applied analysis, and data science. I develop mechanistic models that capture key biological and behavioural processes, and I integrate these models with modern statistical and machine learning approaches to guide decision-making in public and population health.

A recurring theme in my research is the importance of trustworthy and interpretable models in settings where data are limited, noisy, or structurally biased. I am interested in how qualitative model structure, parameter uncertainty, and social context interact to produce complex dynamics, and in how we can design interventions that are effective, equitable, and robust to modelling assumptions.

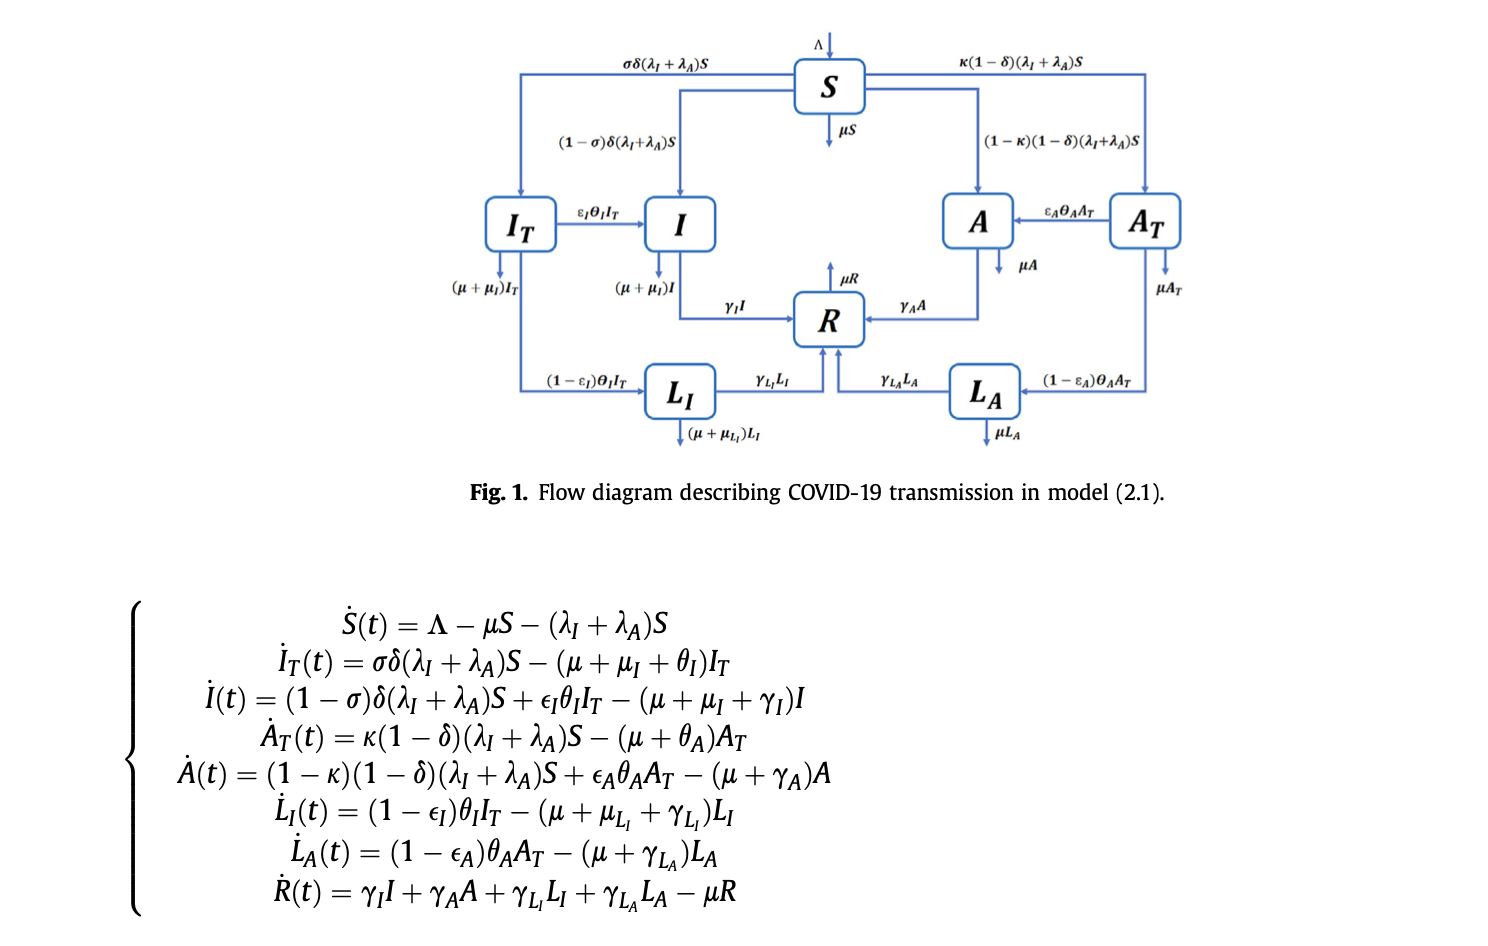
Methodologically, I work with compartmental and hybrid mechanistic–data-driven models, optimal control, sensitivity and uncertainty analysis (including LHS–PRCC pipelines), and numerical simulation. Substantively, my projects span infectious diseases, noncommunicable conditions such as obesity, and social phenomena such as crime, gang activity, and substance use, viewed through the lens of public health.

Current research themes

  • Hybrid mechanistic–machine learning models for health systems. Linking compartmental or agent-based models with ML components to improve prediction and scenario analysis, while retaining interpretability and mechanistic insight.
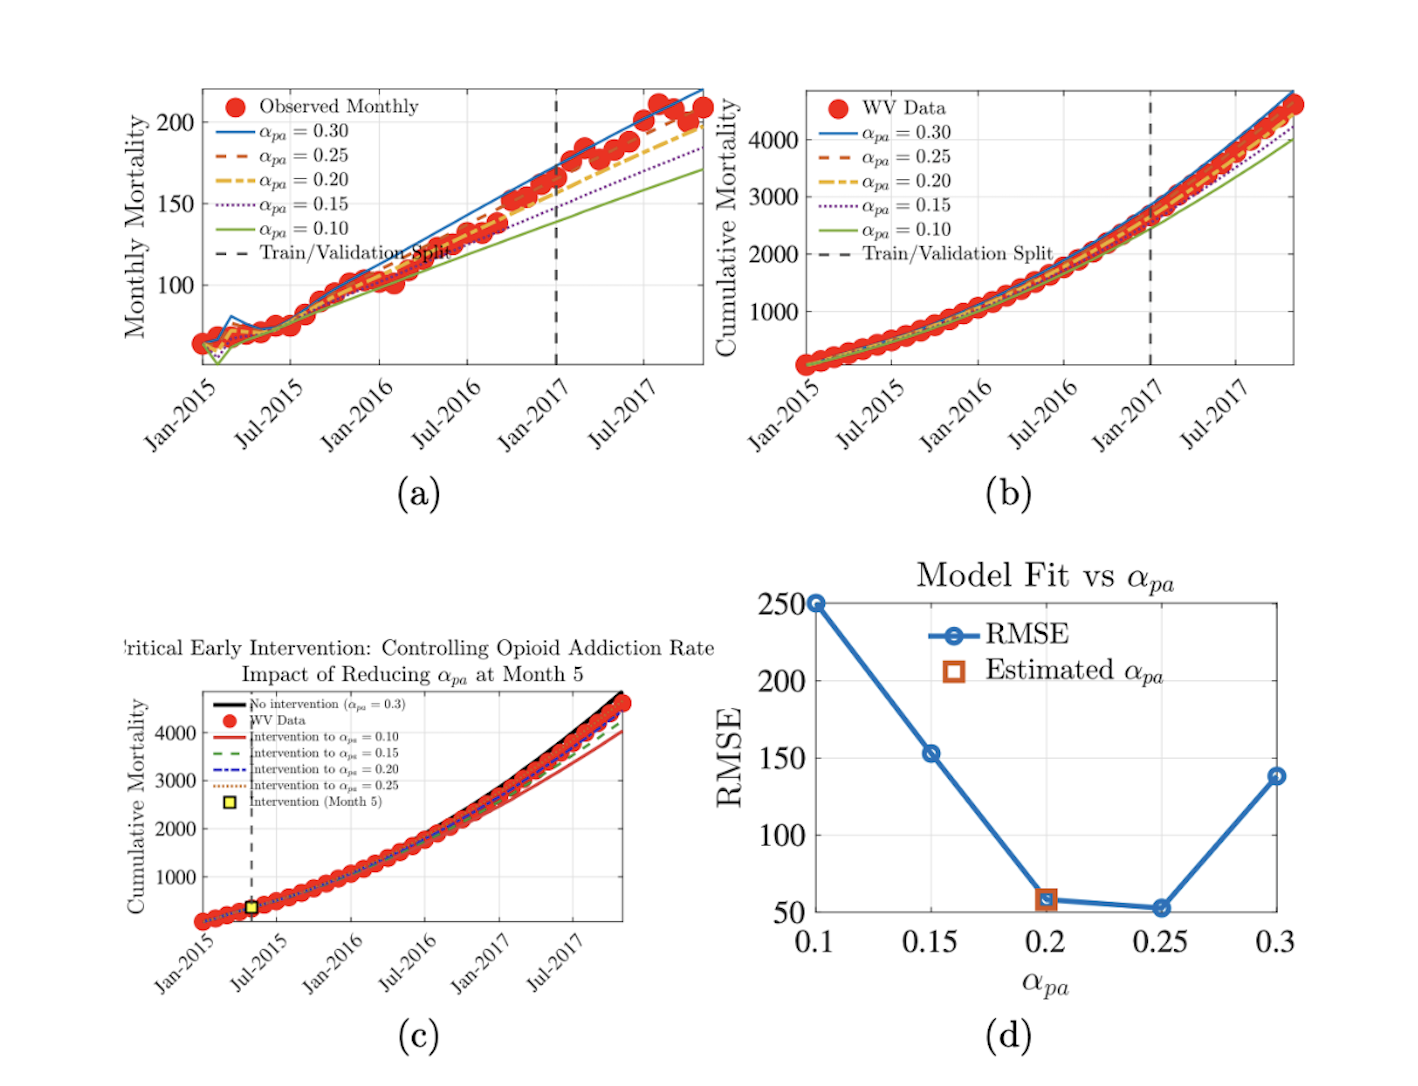
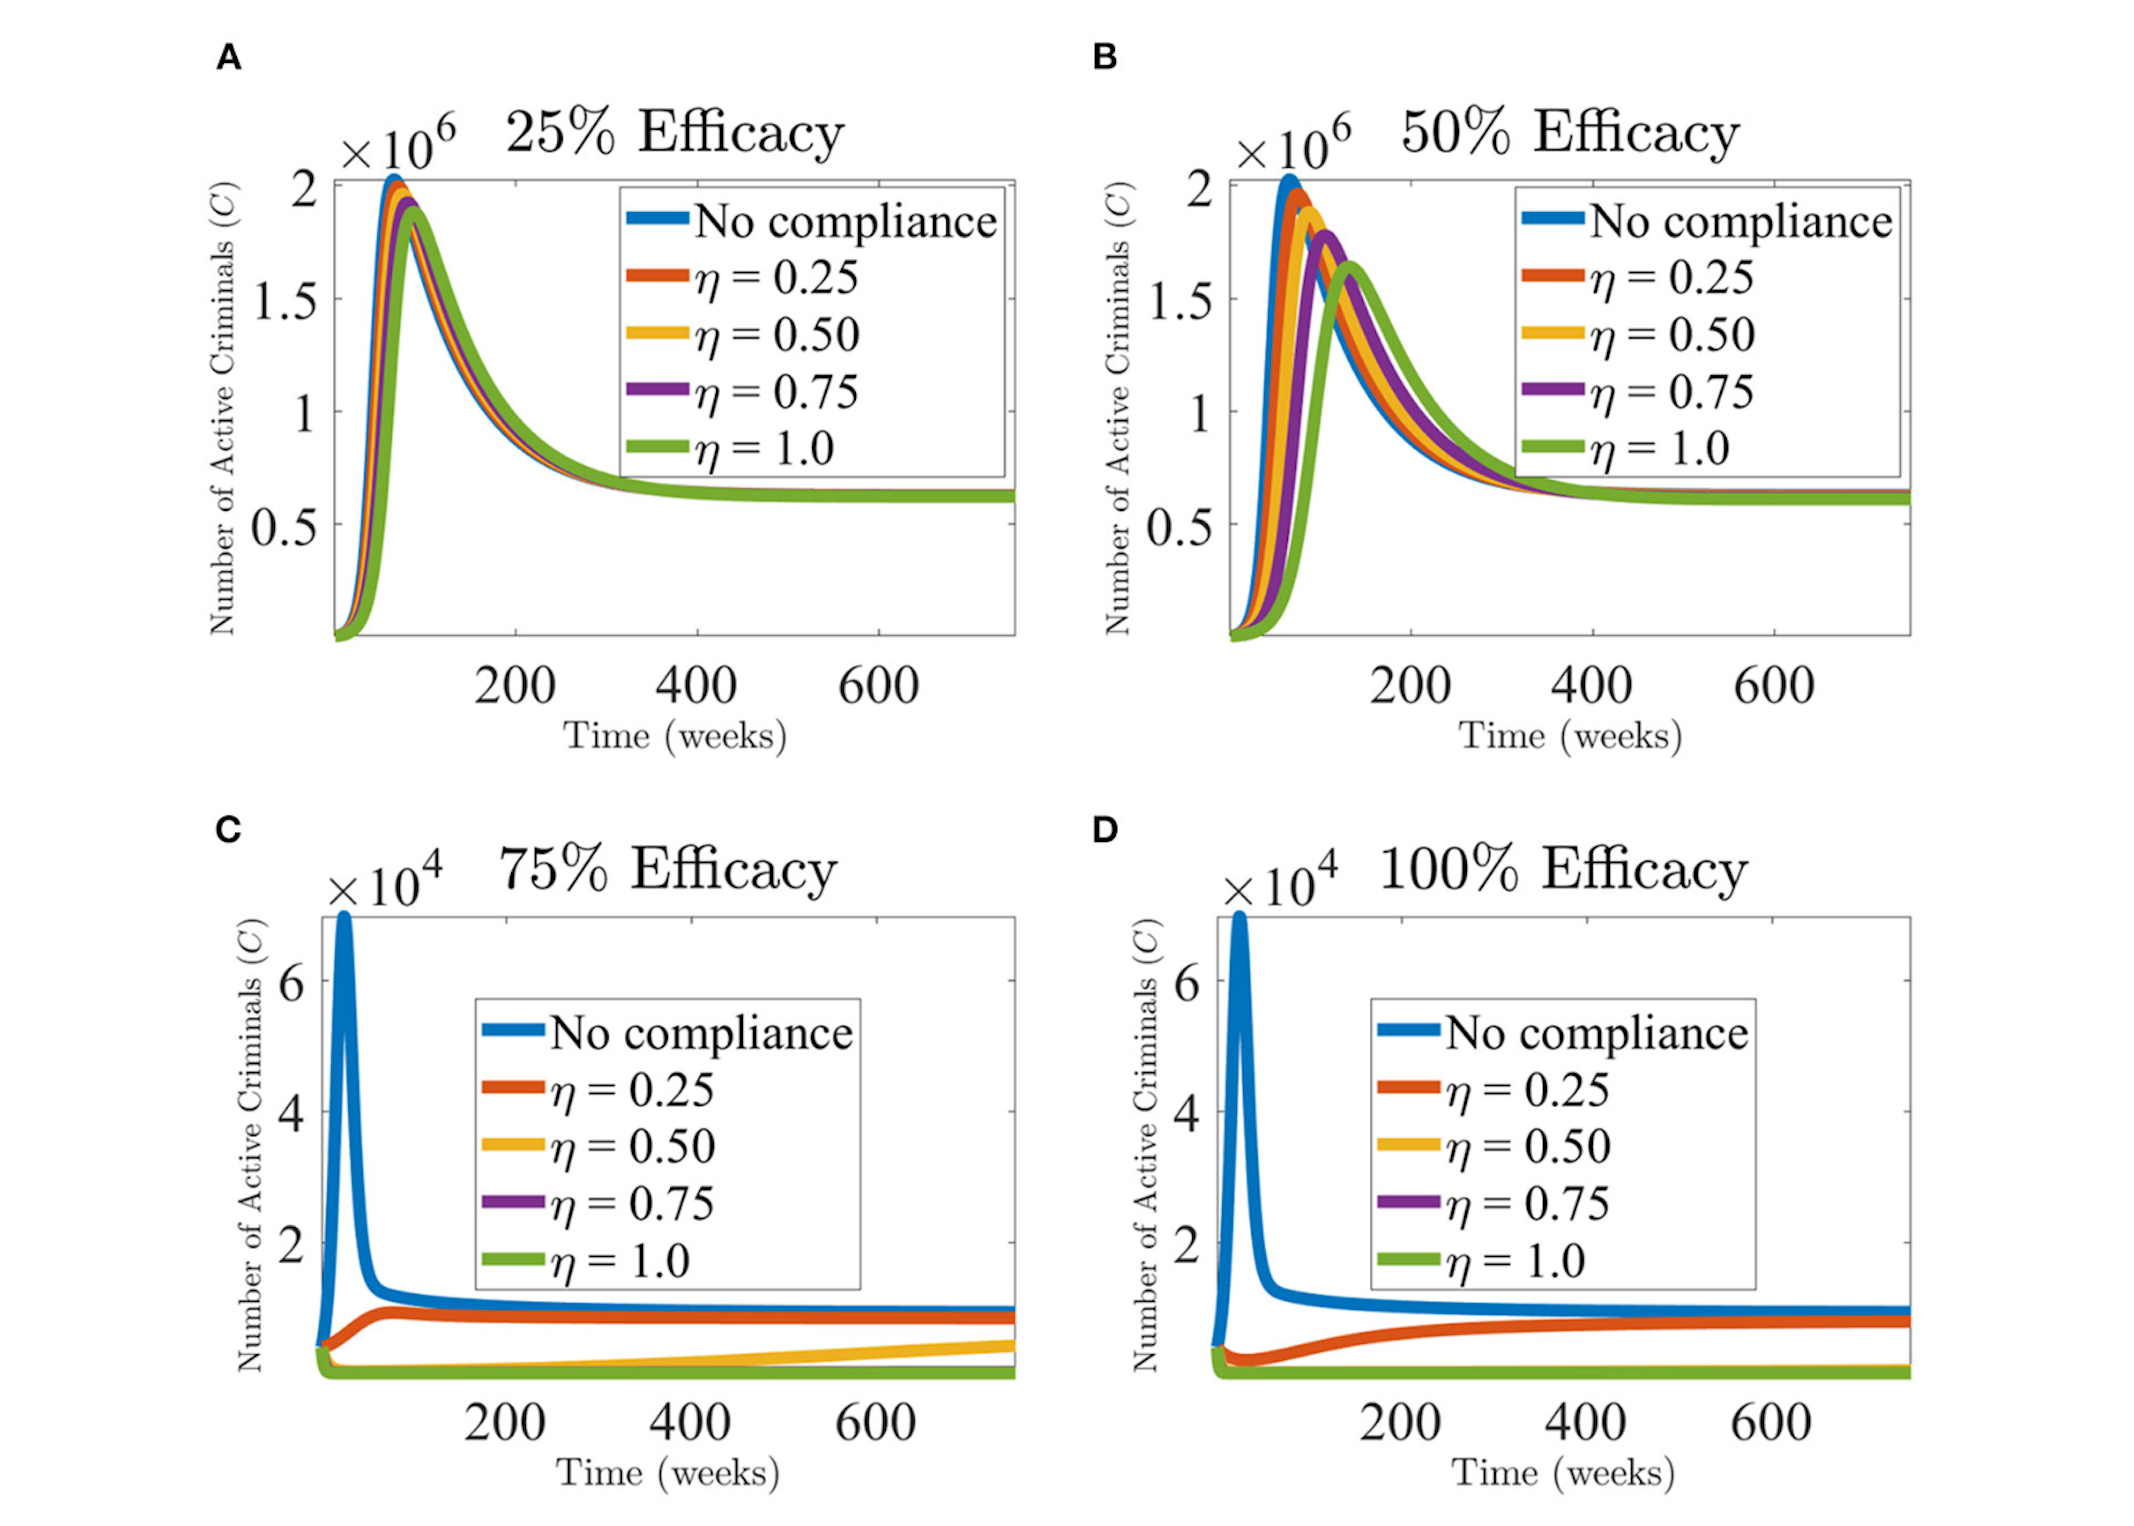
  • Interventions, behaviour, and compliance. Studying how testing, isolation, treatment adherence, and fear-based deterrence influence disease transmission, crime dynamics, and other outcomes, using optimal control and cost-effectiveness analysis.
  • Uncertainty and sensitivity in complex models. Quantifying uncertainty in parameters and initial conditions, and identifying key leverage points for policy through global sensitivity analysis.
  • Equity and heterogeneity. Exploring how heterogeneity in risk, access, and behaviour shapes the impact of public health interventions and predictive models.

Tools & computational practice

Deterministic ODE/PDE modeling Compartmental epidemiological models Hybrid mechanistic–ML pipelines Optimal control & cost-effectiveness Sensitivity analysis (LHS–PRCC) Python · MATLAB · R HPC workflows

Selected research highlights

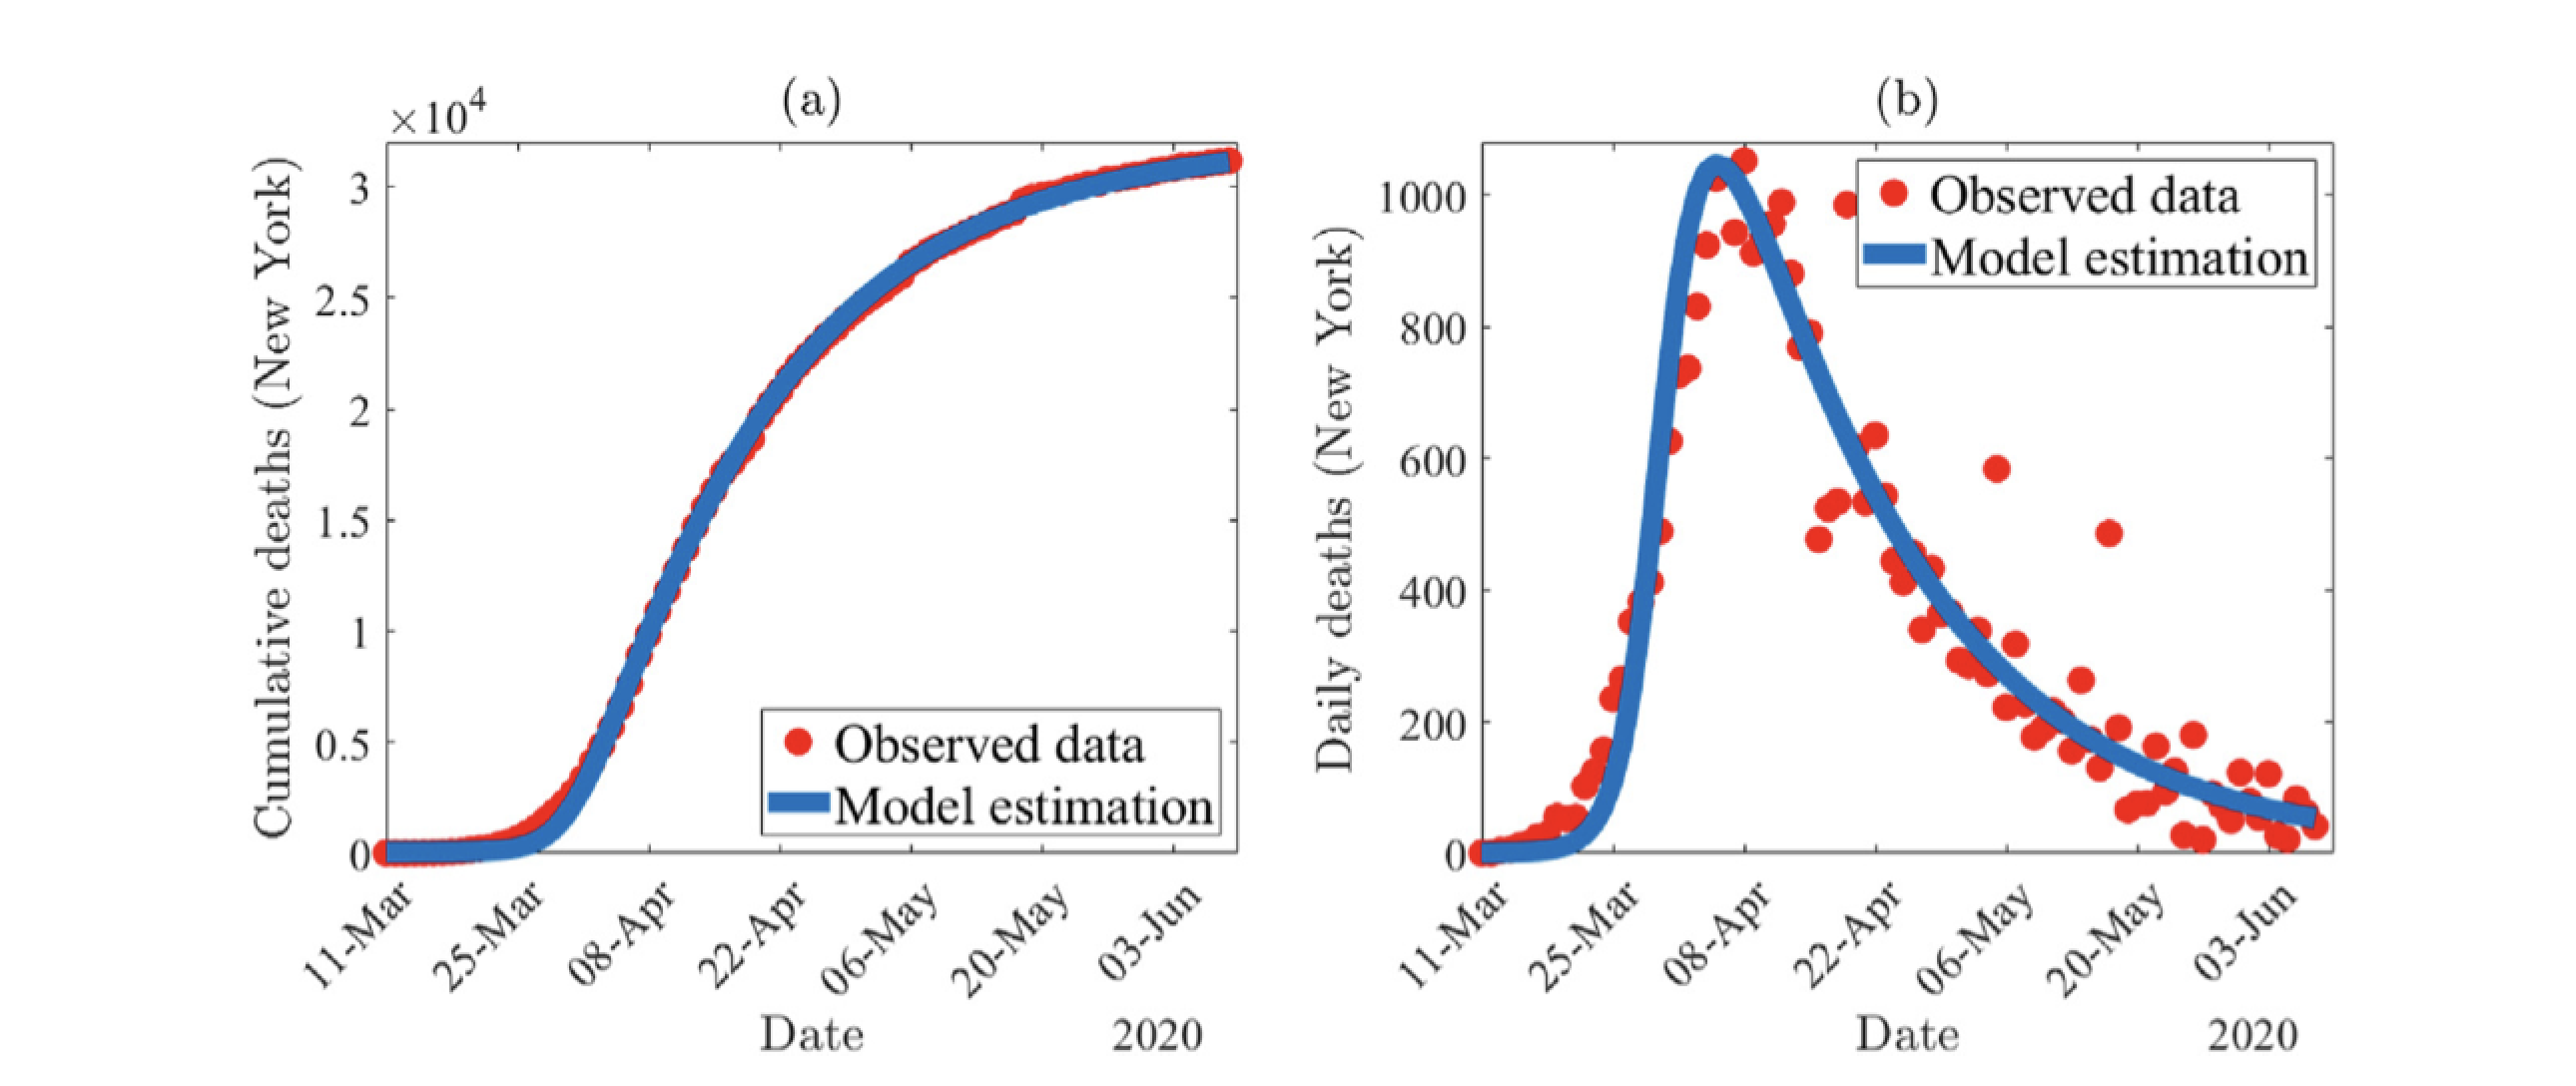
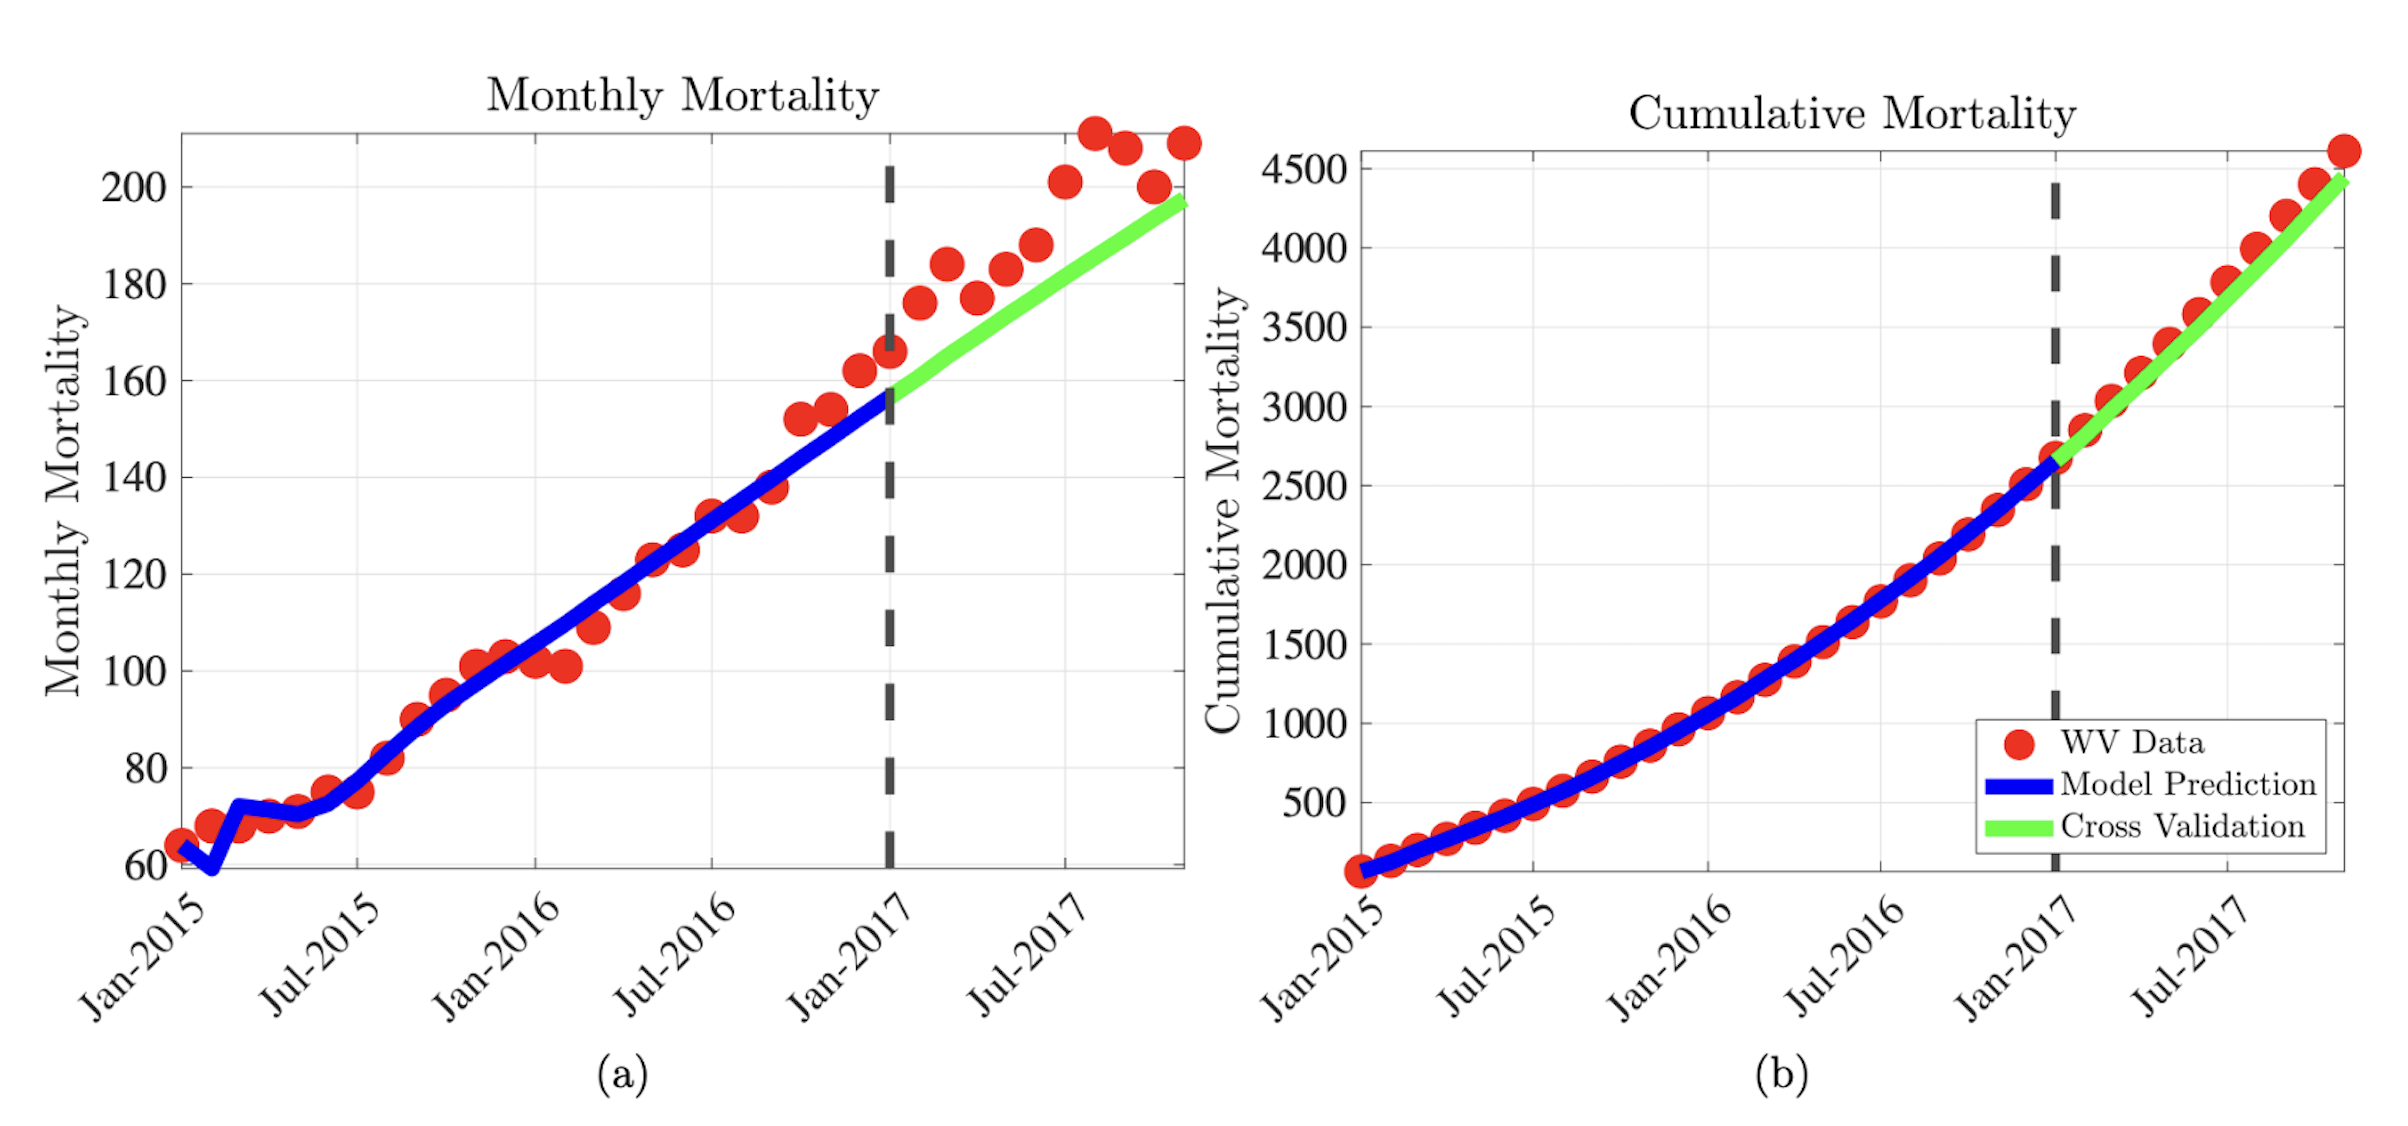
A few recent modeling results and visualizations from ongoing projects on COVID-19, the opioid crisis, and crime dynamics. Please contact me if you would like preprints, code, or additional details.

COVID-19 model trajectories under different testing and isolation strategies
COVID-19 testing and isolation dynamics
Two time-series plots comparing COVID-19 model predictions (blue) with observed data (red) for New York: The left panel shows cumulative deaths, where the model closely tracks the sigmoidal rise seen in the real data. The right panel shows daily deaths, capturing the sharp early-April peak and the subsequent decline, demonstrating good agreement between modeled and observed epidemic dynamics.
Schematic diagram of the COVID-19 transmission model
Structure of the COVID-19 transmission model
Model schematic showing infectious, exposed, and isolated compartments and the flows used in the testing and isolation analysis.
Model-based trajectories of opioid use and recovery under different interventions
Dynamics of the opioid crisis
This figure presents the model fitting and cross-validation results for the opioid addiction model using West Virginia overdose mortality data from January 2015 to December 2017. Panel (a) compares observed monthly mortality (red dots) with the model’s fitted predictions (blue curve) during the training period and the model’s cross-validated projection (green curve) after the January 2017 split. The plot shows that the model accurately captures the steady upward trend in monthly deaths and maintains good predictive performance beyond the fitting window. Panel (b) displays the corresponding cumulative mortality curves, again demonstrating close agreement between observed data and the model’s fitted trajectory during the training period, as well as strong predictive alignment in the cross-validation period. Together, the two panels illustrate that the calibrated model reproduces both the short-term and long-term mortality dynamics with high fidelity, validating its reliability for forecasting and policy experimentation.
Phase-plane or schematic representation of opioid model structure
Structure of the opioid use model
A multi-panel visualization showing modeled versus observed opioid mortality trends: The upper plots compare monthly and cumulative mortality under different values of a key transition parameter (e.g., prescription-to-addiction rate), while the lower plots show how early reductions in this parameter can significantly flatten mortality curves. Together, the figure highlights how different parameter choices and timing of intervention influence the trajectory of opioid-related deaths.
Model-based trajectories of crime and fear dynamics
Crime, fear, and deterrence
A four-panel figure illustrating how crime levels evolve under varying intervention efficacies and compliance rates. Each panel (25%, 50%, 75%, 100% efficacy) displays simulated trajectories of active criminals over weekly time scales, revealing that higher intervention efficacy and greater compliance substantially reduce both the peak crime burden and long-term criminal activity compared to scenarios with low compliance.